
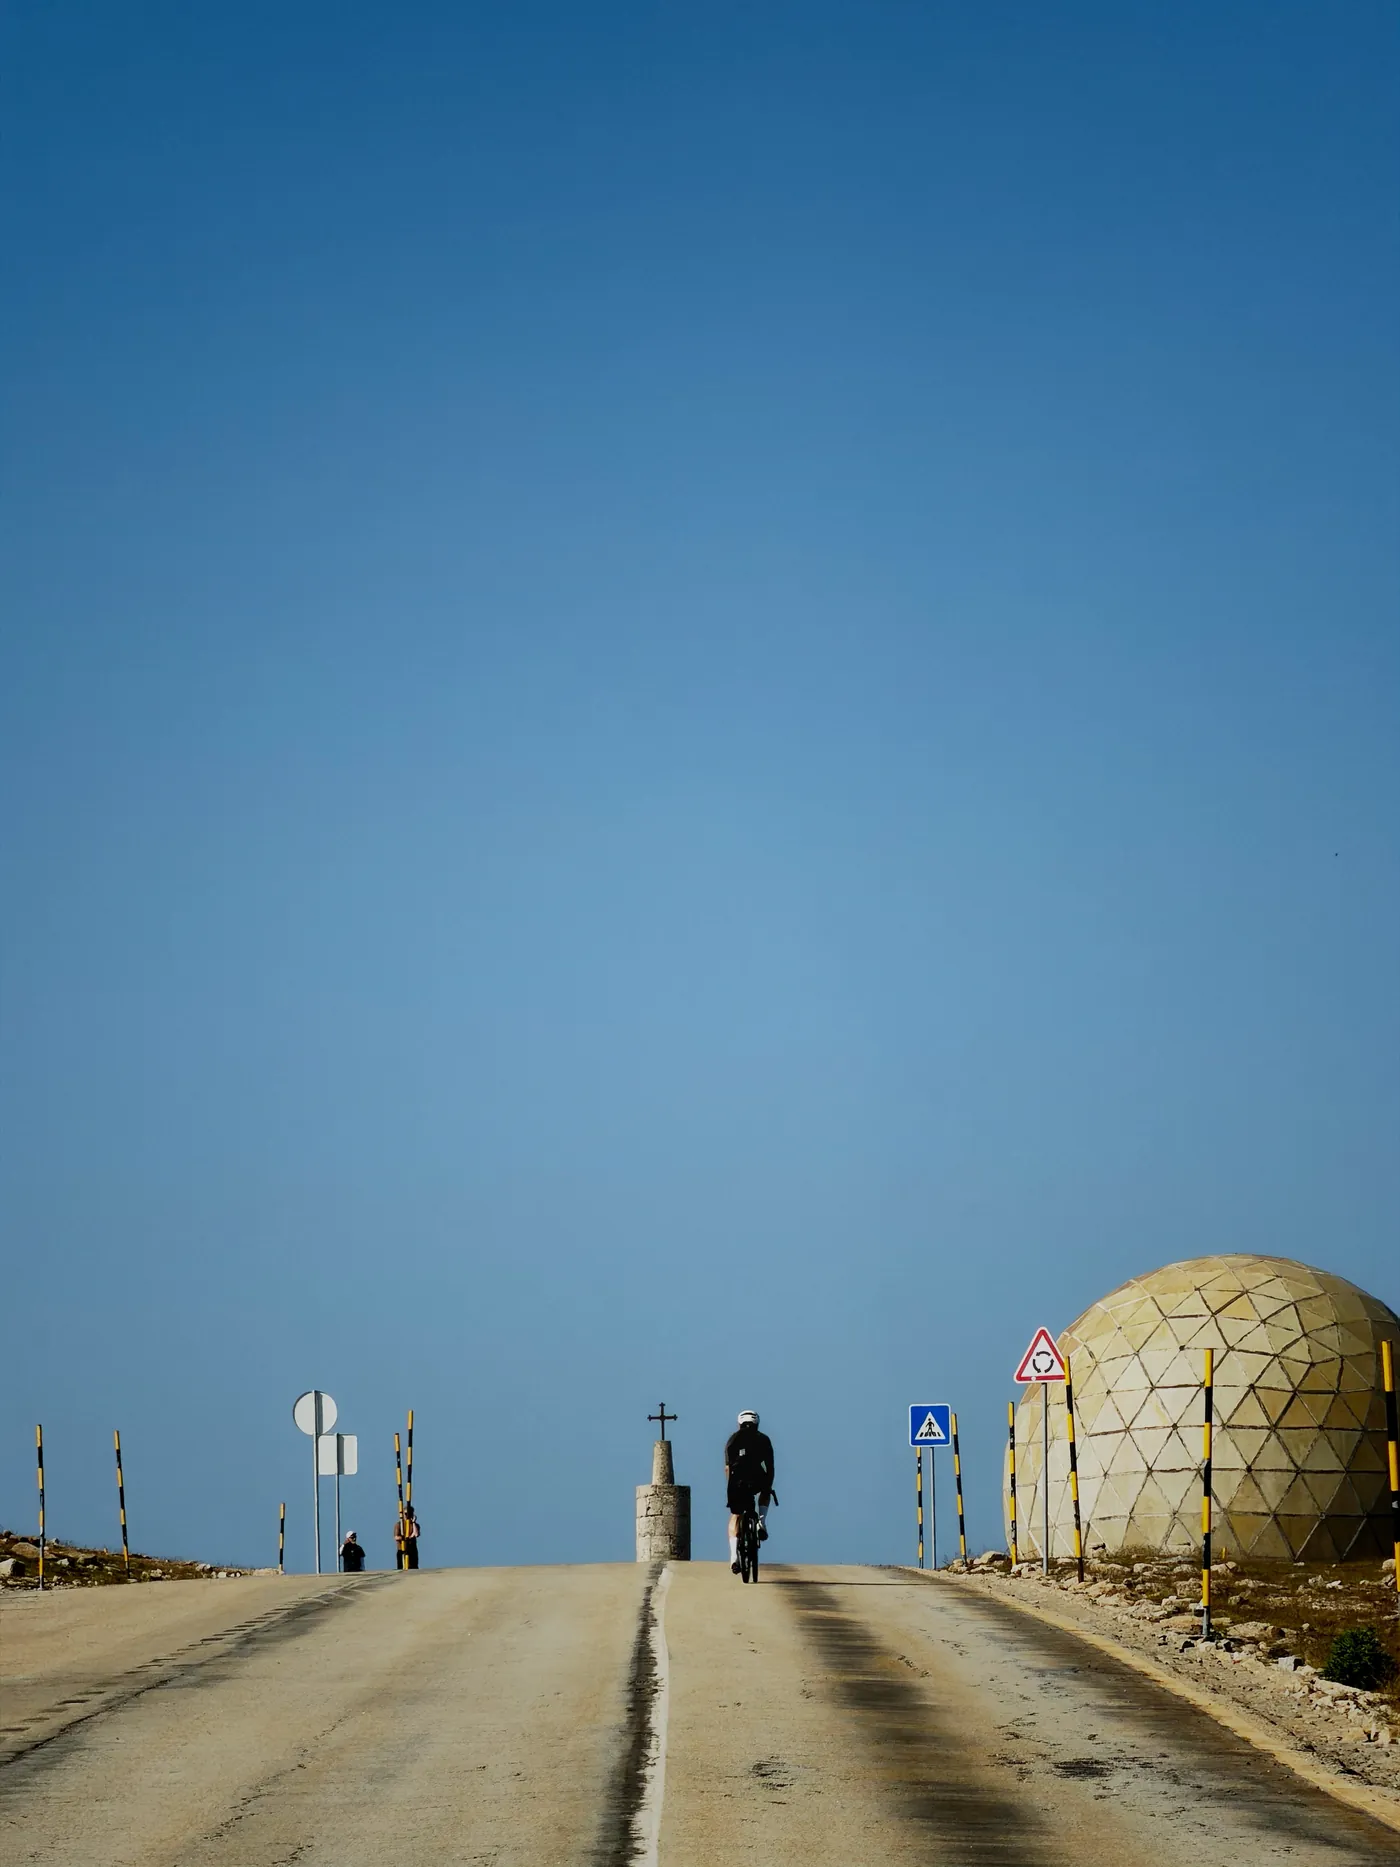
On the sixth morning I rolled down to the Guadiana, the river that marks the Portugal–Spain border in the deep south, and stopped the clock. Six days earlier I'd started in the far north, in the Gerês mountains near the Spanish border in Minho. In between: 999 km, 15,841 m of climbing, and roughly 1,680 TSS stacked into a single week.
People asked how I "survived" it. Wrong question. I didn't survive it — I arranged it. Every one of those six days was a number I'd already seen months earlier, on a chart, when I reverse-engineered what a rider with my fitness could absorb day after day without falling apart on day four. This is the write-up of that process: the five-month build, the load per stage, and the fueling maths. If you coach yourself and you already know your TSS from your TSB, this is a worked example you can steal.
Who this is for (and what you'll actually get)
If "CTL," "TSB," and "a negative ramp going into a taper" mean something to you, keep reading. This isn't an adventure diary. You'll get the real training-load arc that built the durability, the per-stage load table with power and heart rate, and the decision logic behind the fueling. Numbers are from my own files — FTP 309 W, 81 kg, so about 3.8 W/kg — not rounded for a nicer story.
Want the season template I used?
I'll send you the CTL-ramp + base/build/peak planning sheet, plus the Gran Diagonal fueling table. One email, then the occasional data-driven note. No spam.
The target: reverse-engineering six days from the chart
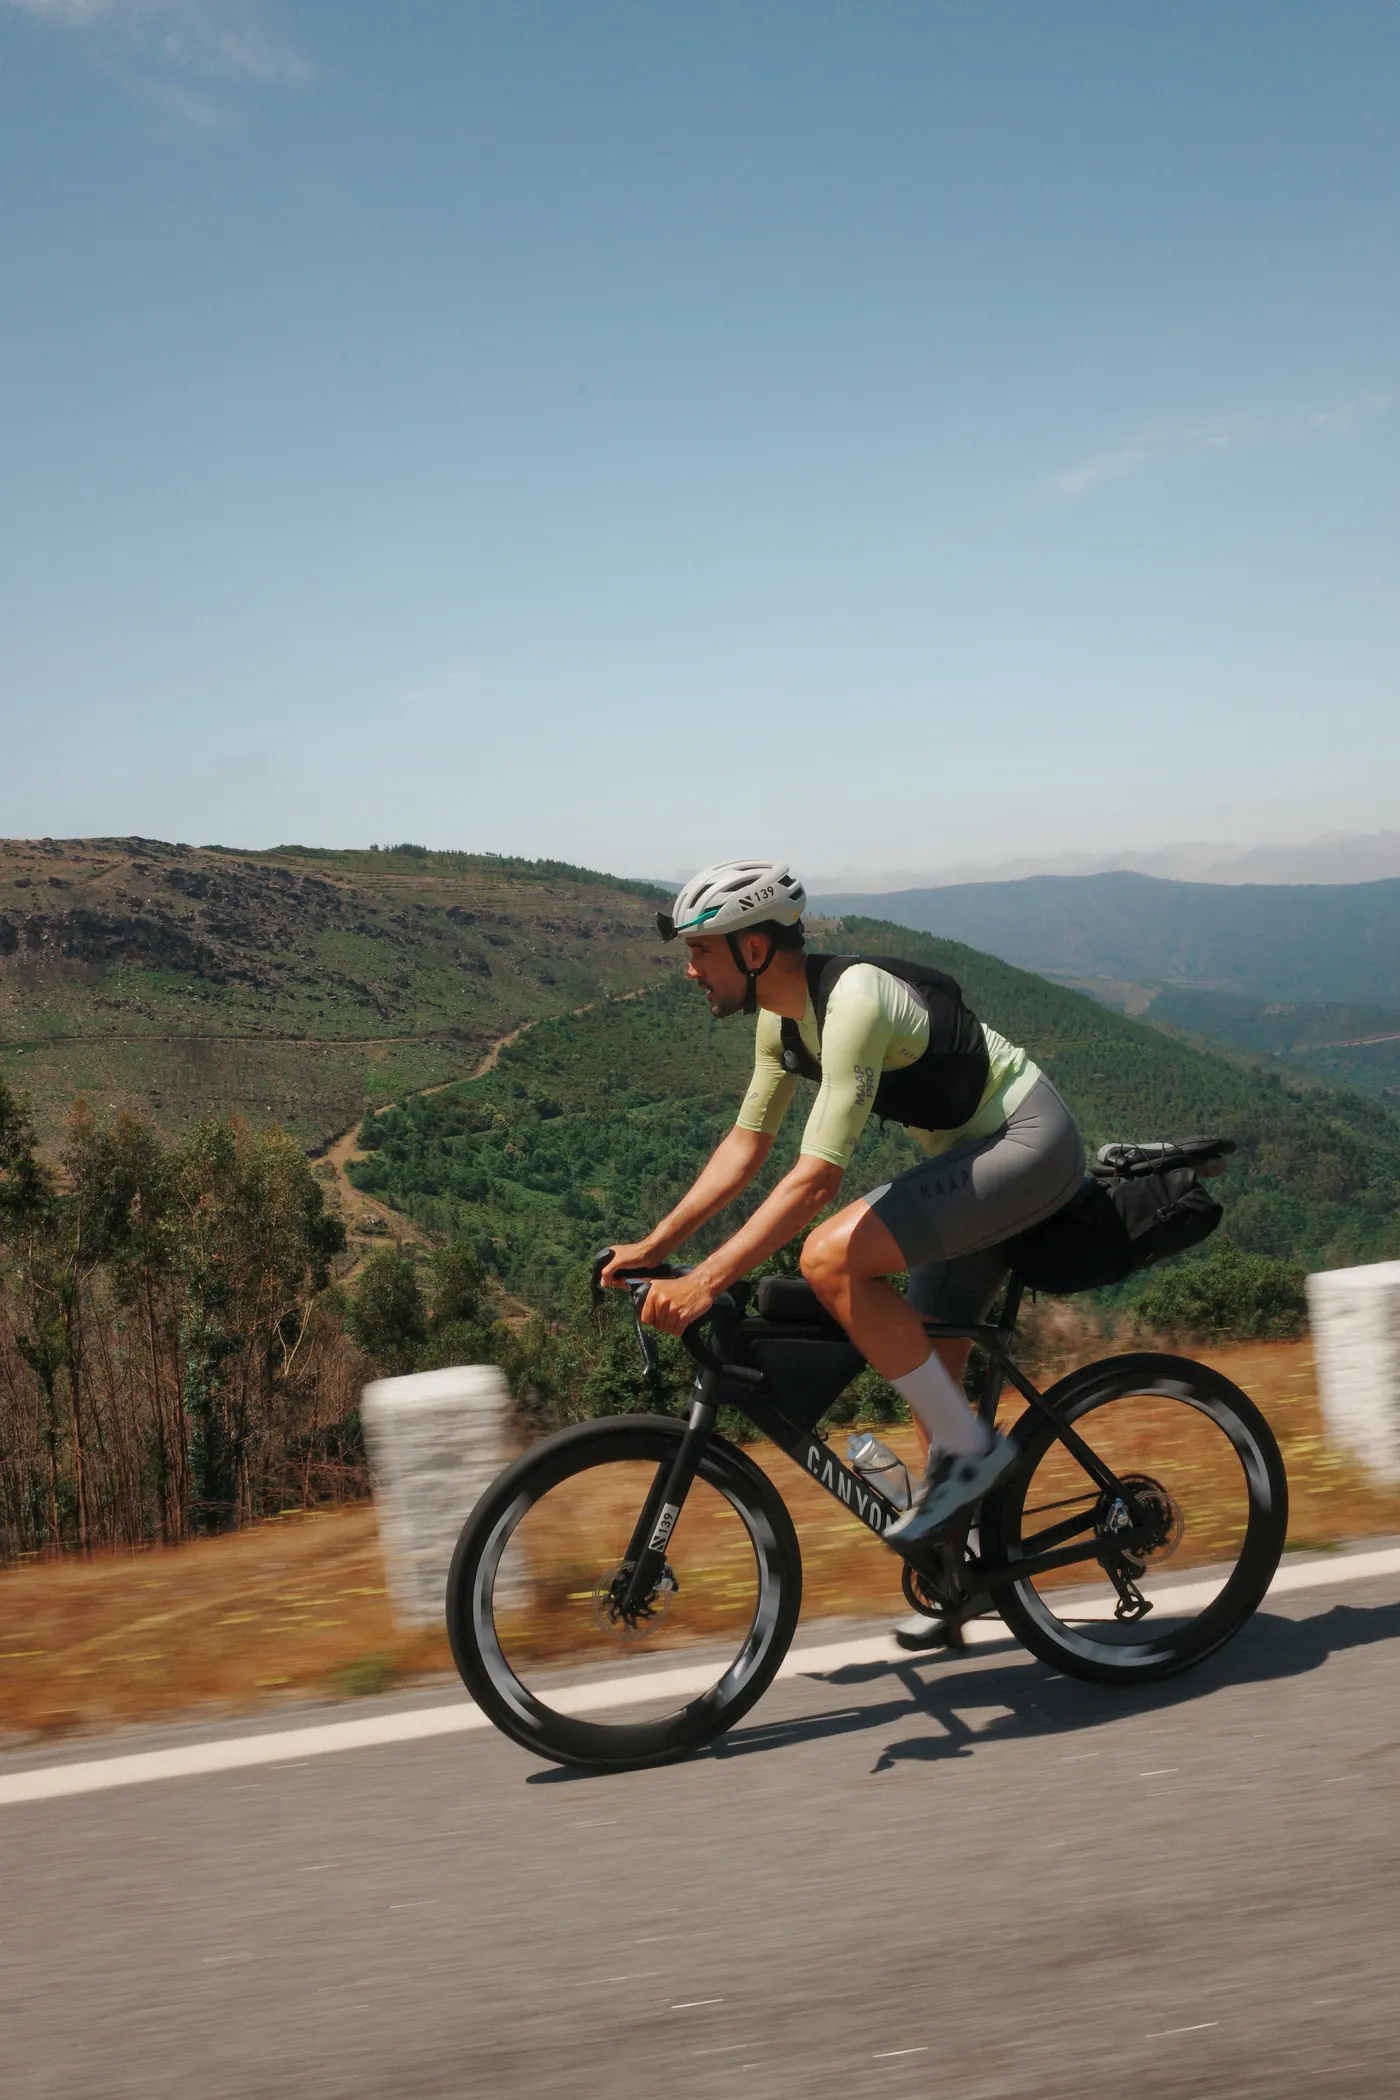
A one-day epic is a willpower problem. Six days back-to-back is a durability problem, and durability is built, not summoned. So the planning started at the end and worked backwards: six days averaging north of 280 TSS, on rolling-to-mountainous terrain, at an intensity low enough to repeat tomorrow.
That last constraint is the whole game. Ride day one too hard and you don't pay for it on day one — you pay on day four, when the accumulated fatigue (ATL) has buried your form and a 3,000 m mountain stage is still in front of you. The plan was therefore two numbers: a chronic load (CTL) high enough that ~280 TSS/day sat only moderately above my daily average, and a stage intensity capped well below threshold so the fatigue curve stayed manageable across the week.
That is a heavy week by any measure. To make ~280 TSS/day repeatable rather than ruinous, I wanted my chronic load high going in and to arrive slightly fresh — not deep in a hole. That set the shape of the whole spring.
The five-month build (what the chart actually did)
The fitness didn't come from "putting in miles." It came from a deliberate progression I could see week to week, with the midweek sessions prescribed by the engine and the weekends spent turning granfondos into training load.
Performance Management Chart · 2026 seasonMY REAL DATA
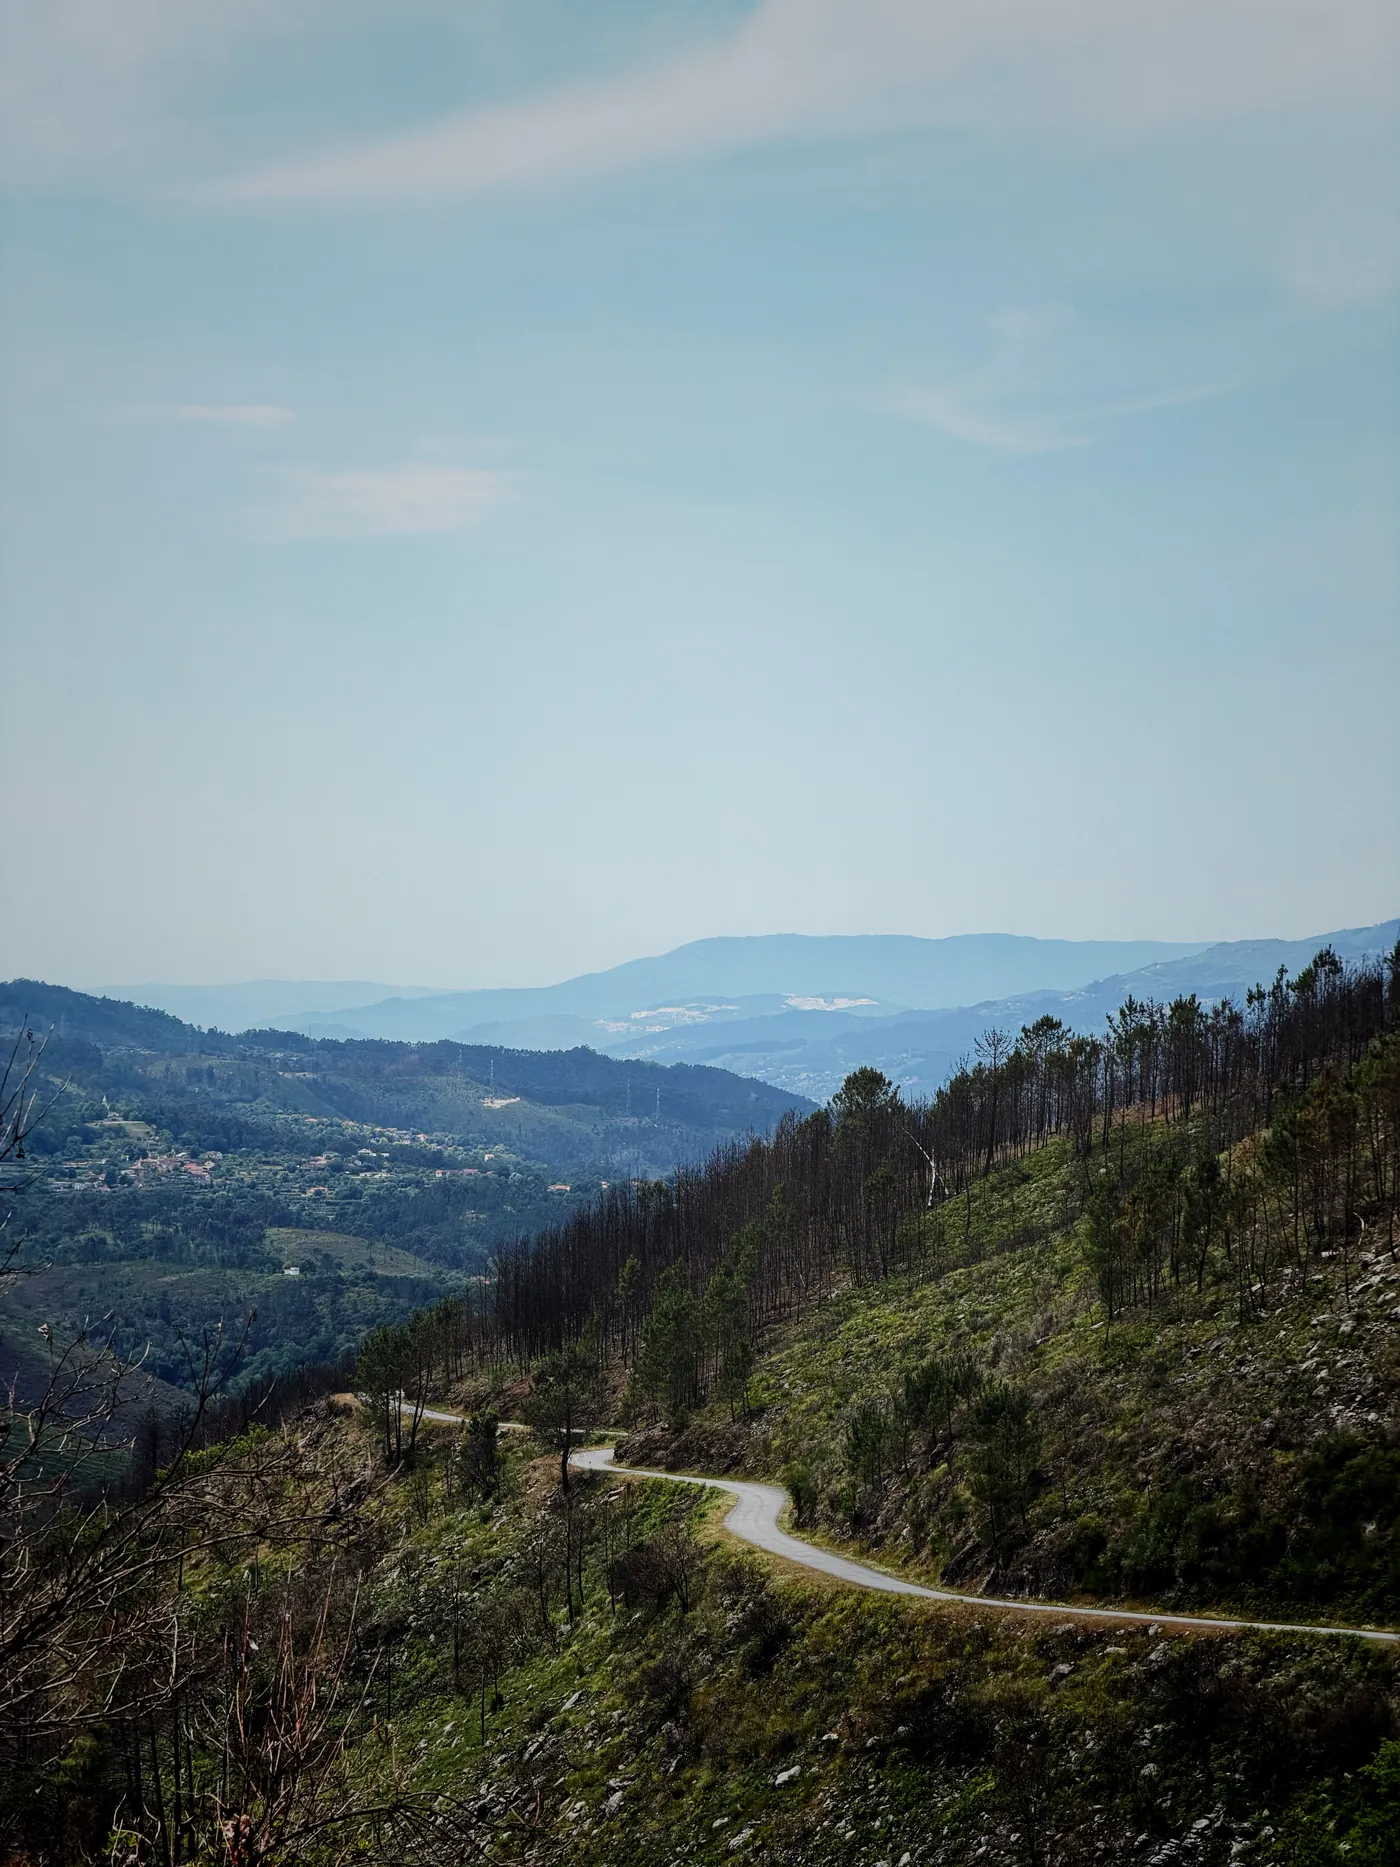
- Winter base (Jan–Feb). Aerobic volume plus structured midweek work — endurance, tempo, sweet spot and the first VO2 touches. A block on the Costa Blanca stacked three back-to-back days early, a small rehearsal of consecutive-day load.
- Build (Mar–Apr). Intensity got specific. The engine's threshold and VO2 sessions two or three times a week, with long events on the weekends — a 156 km UCI granfondo in March, a 184 km day in April — pushing CTL up without wrecking the ramp.
- Peak load (May). The heaviest three weeks of the year: a 152 km event, then a 169 km / 3,628 m Cerdanya day, then a 123 km / 2,913 m mountain "queen stage." This is where CTL topped out and my legs were, correctly, heavy.
- Sharpen (early Jun). Volume came off, a little intensity stayed, and I let the fatigue drain so I'd start the crossing fresh but still fit. The day before the start was a short priming opener — three efforts and a sprint, 74 TSS — to wake the legs up, not to train.
On the numbers
Every one of those midweek sessions came out of the engine with a target and a tolerance — for example a VO2 block written as TSS 47 / IF 0.83, and afterwards logged at +3% vs plan. That's the point of a deterministic model: the plan is a number before you ride, and a variance you can read after. Nothing here was a suggestion from a chatbot; it was sports-science maths I could check against reality every single day.
Stage by stage: what the numbers demanded
Here's the crossing itself — real files, nothing smoothed. Note how the average power stays deliberately low even on the biggest days: that's not weakness, it's the intensity cap doing its job so day five doesn't cost me day six.
| Stage | Dist | Climb | Moving | Avg P | Avg HR | kcal | TSS* |
|---|---|---|---|---|---|---|---|
| Day 0 · Priming | 39 km | 460 m | 1:46 | — | — | 840 | 74 |
| Day 1 · Gerês → Minho | 153 km | 3,247 m | 7:31 | 149 W | 131 | 4,502 | 314 |
| Day 2 | 131 km | 2,279 m | 5:56 | 145 W | 123 | 3,452 | 231 |
| Day 3 | 142 km | 2,439 m | 6:15 | 151 W | 125 | 3,788 | 240 |
| Day 4 · Queen · Torre | 183 km | 3,191 m | 8:15 | 144 W | 123 | 4,774 | 314 |
| Day 5 · Alentejo (longest) | 222 km | 2,767 m | 8:57 | 138 W | 120 | 4,945 | 322 |
| Day 6 · to the Algarve | 167 km | 1,917 m | 6:38 | 149 W | 122 | 3,972 | 258 |
| Total (days 1–6) | 999 km | 15,841 m | 43:32 | — | — | 25,433 | 1,679 |
*Every number here — distance, climbing, moving time, power, heart rate, kcal and TSS — comes straight from the activity files and the engine's model (FTP 309 W). Nothing is rounded or estimated.
Load per stage · Gran DiagonalMY REAL DATA
The shape is the story. Day 1 was the hardest by climbing — 3,247 m out of the Gerês, the single biggest relative effort of the week — so it demanded the most discipline to ride easy when the legs were fresh and wanted to go. Day 4 was the queen stage: the climb to the Torre, the highest road in mainland Portugal, 19 km and nearly 1,400 m of ascent through the Serra da Estrela. Day 5 was the longest at 222 km across the Alentejo — yet the average power actually drops there — it was the single highest-load day of the week (322 TSS), ridden at the lowest intensity. That's not fade; that's management: at nearly nine hours, duration does the damage, so the job was to spend as little as possible per kilometre and still get there.
Fueling by the numbers
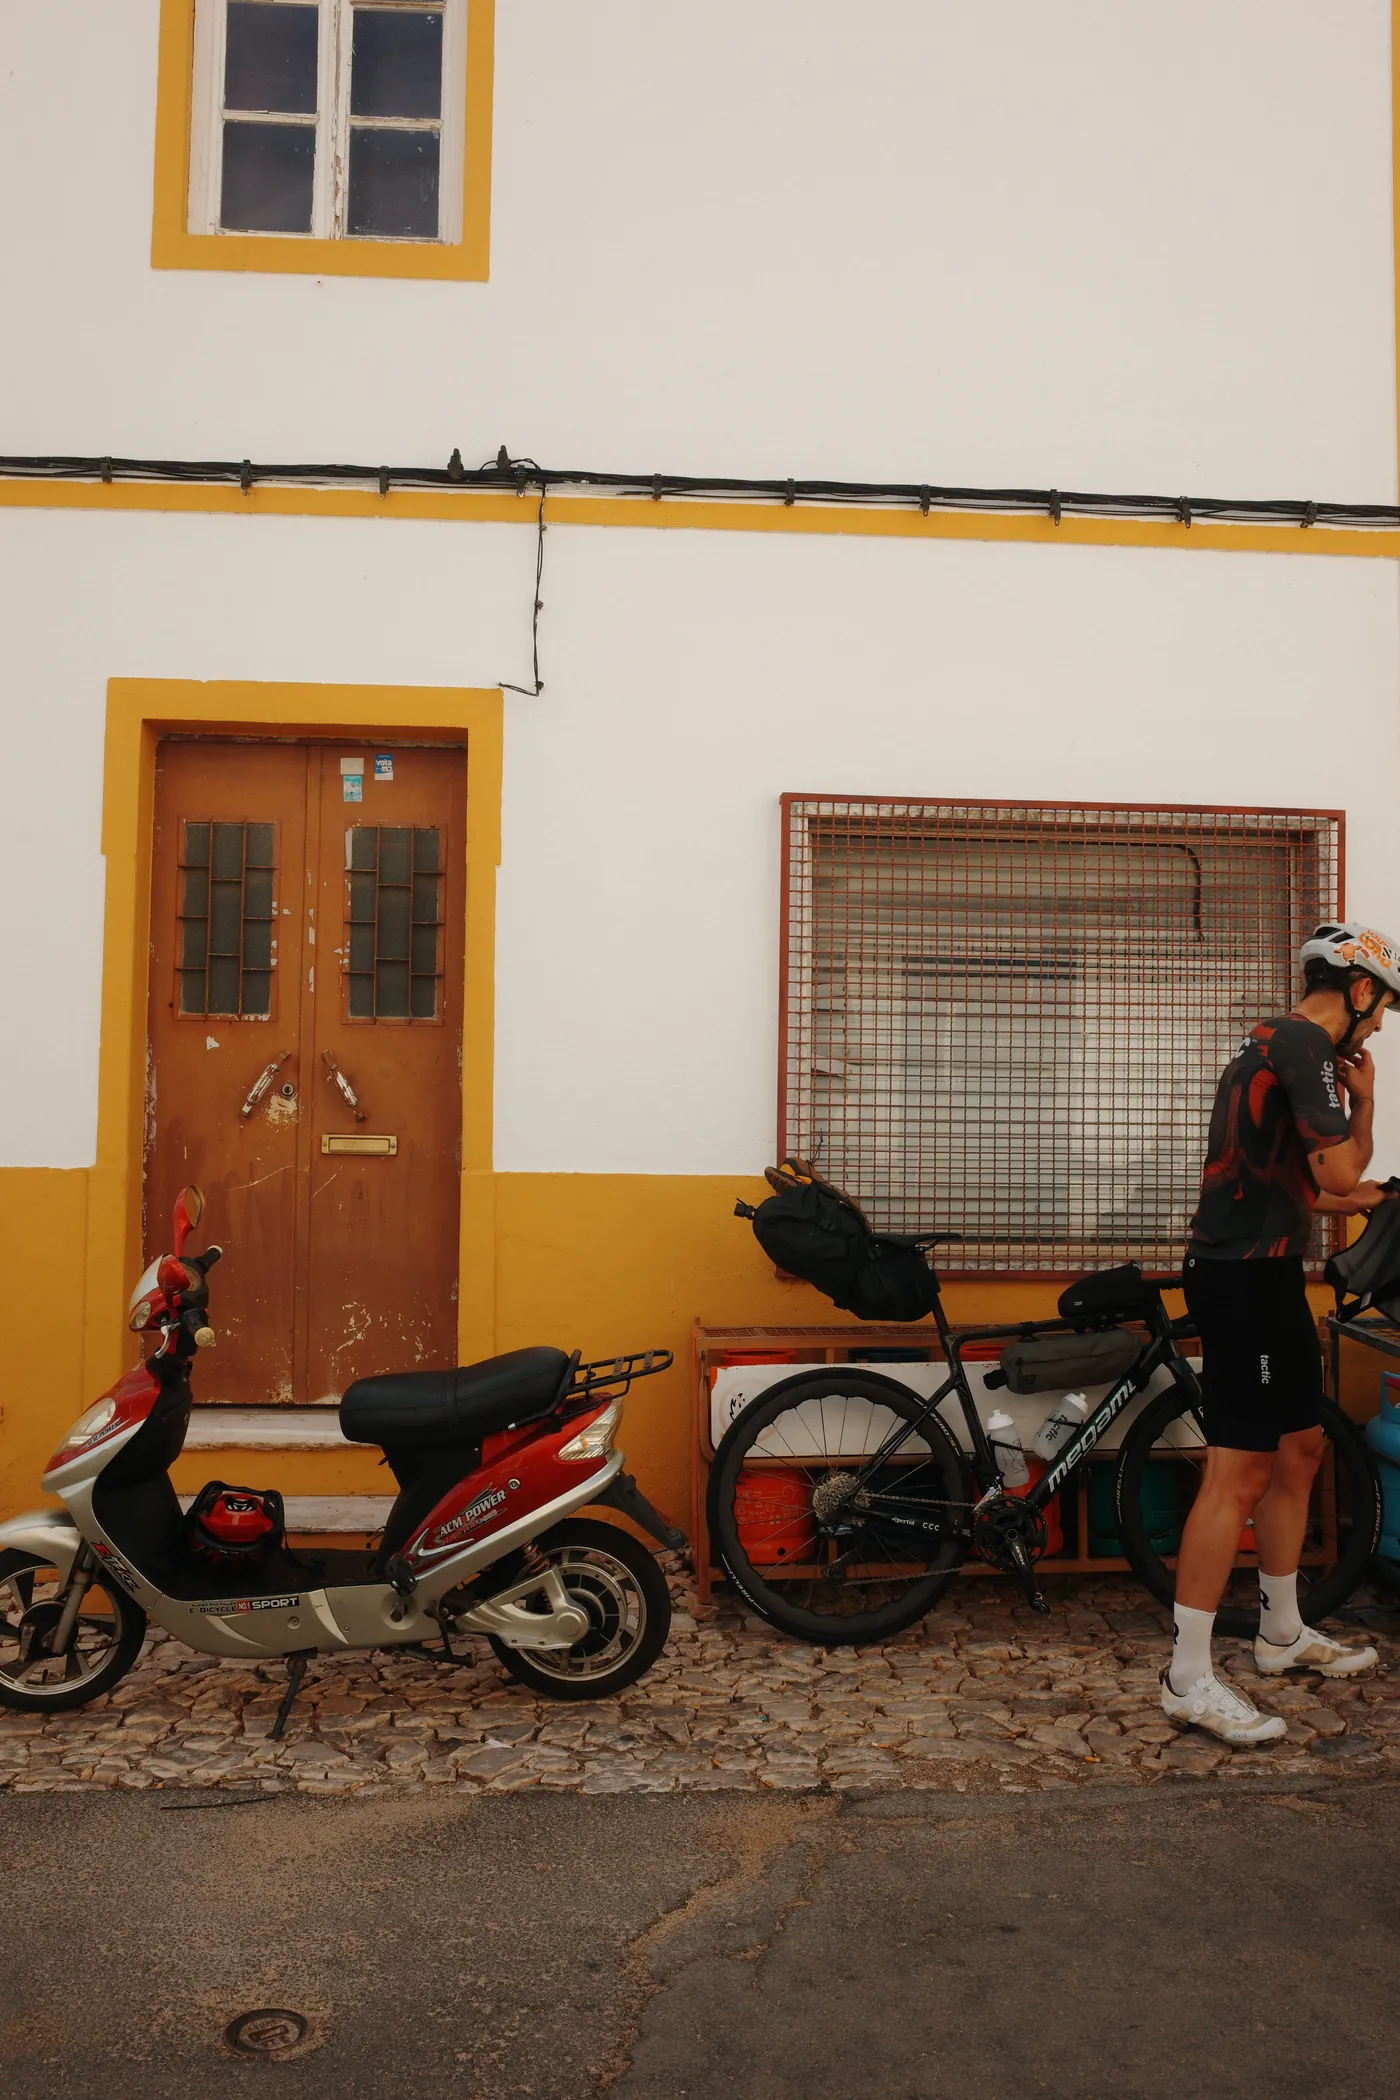
The files logged about 25,400 kcal burned on the bike over six days — roughly 4,200 a day, before you count everything the body spends just being alive and recovering. Nobody eats that back. So multi-day fueling isn't about "replacing" energy; it's about minimising the deficit so tomorrow's engine still starts.
The logic I rode to:
- On the bike: carbohydrate scaled to stage length, not appetite. The long mountain days sat at the top of what I can absorb per hour; the shorter days a notch below. Carbs are the lever because at 6–9 hours a day, fat can't cover the intensity spikes on the climbs.
- The moment you stop: the recovery window is real when you're doing it again in 16 hours. Carbohydrate + protein immediately, then a proper meal, then keep grazing. Every gram you get in before sleep is fatigue you don't carry into the next stage.
- Read the drift, not the feelings: when heart rate at a given power starts creeping up across days — cardiac drift stacking on accumulated fatigue — it's usually under-fueling before it's lost fitness. The fix is food, not heroics.
What the data taught me
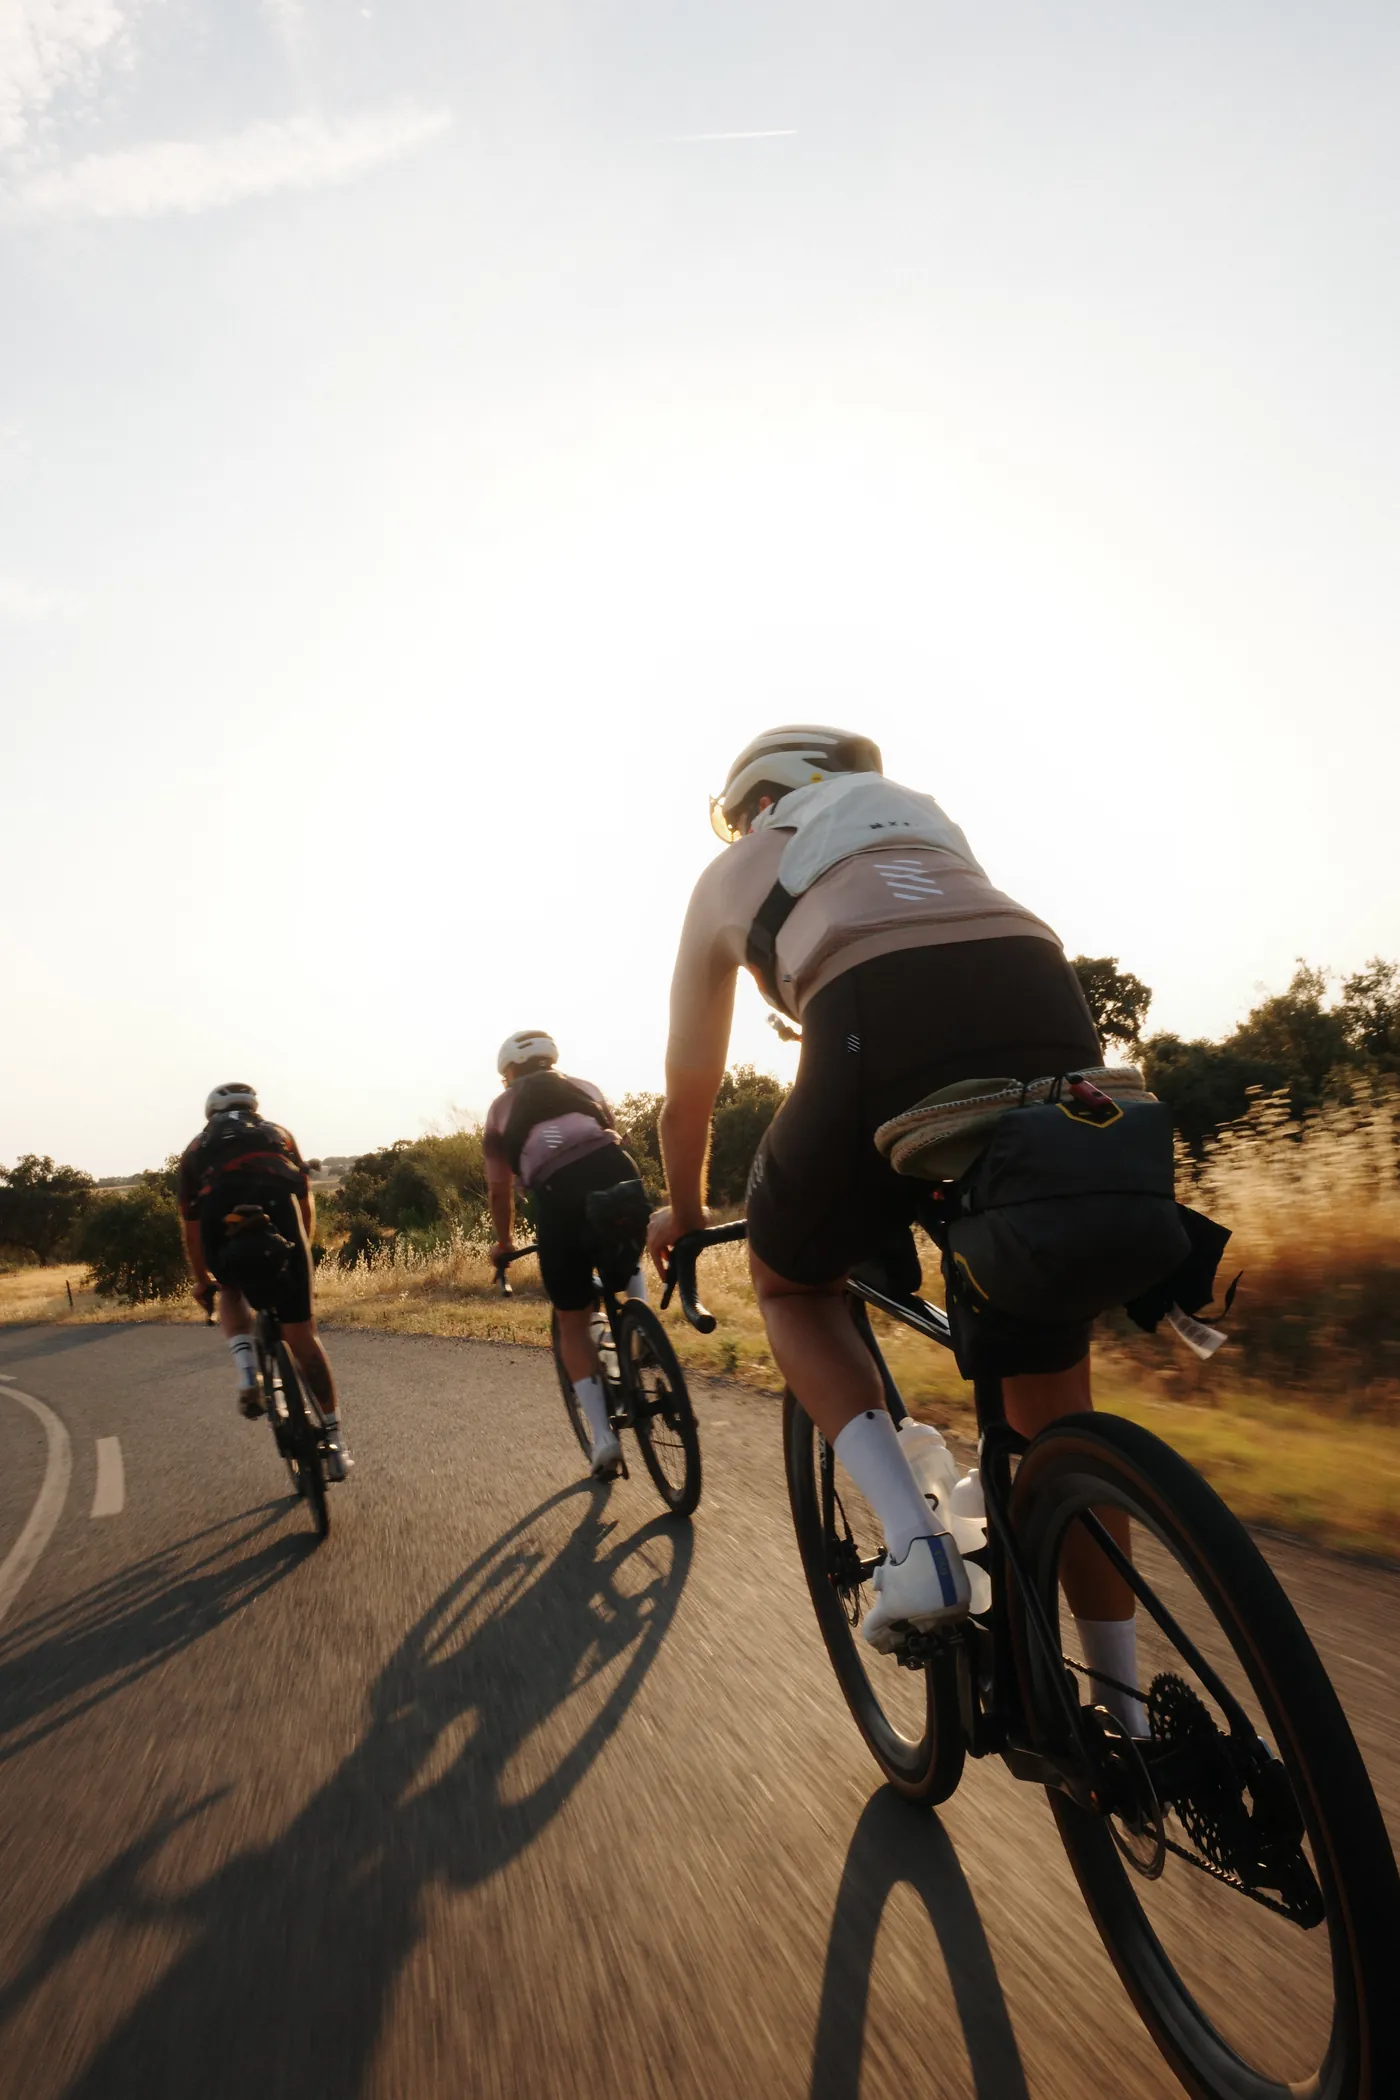
Three honest takeaways. First, the intensity cap worked: HR held remarkably steady day to day (120–131 average across the six), which is exactly what you want to see — no runaway drift means the load was survivable and the fueling roughly right. Second, I could have started with a touch more freshness; a slightly deeper taper would have cost nothing and bought a better day one. Third, and most important: none of this was luck. The week matched the plan because the plan was made of numbers I'd tested for five months, not a feeling I had at the start line.
The uncomfortable part
This is doable by any self-coached rider who's willing to treat their season as a system: a target, a ramp, a load per week, a taper. The hard bit isn't the riding — it's holding the discipline to ride easy when you're fresh, to recover when the chart says recover, and to trust a number over a mood. The chart doesn't care how good your legs feel today.
Run your own numbers
The CTL curve, the weekly load target, the planned-vs-actual on every session — the engine computes all of it from your data. Not a chatbot that talks training at you: sports-science maths that projects your season, and tells you what tomorrow should be and why.

Get the season template + fueling sheet
The exact CTL ramp and base/build/peak structure behind this crossing, plus the fueling table — free. Then a few data-driven training notes over the season. Unsubscribe anytime.